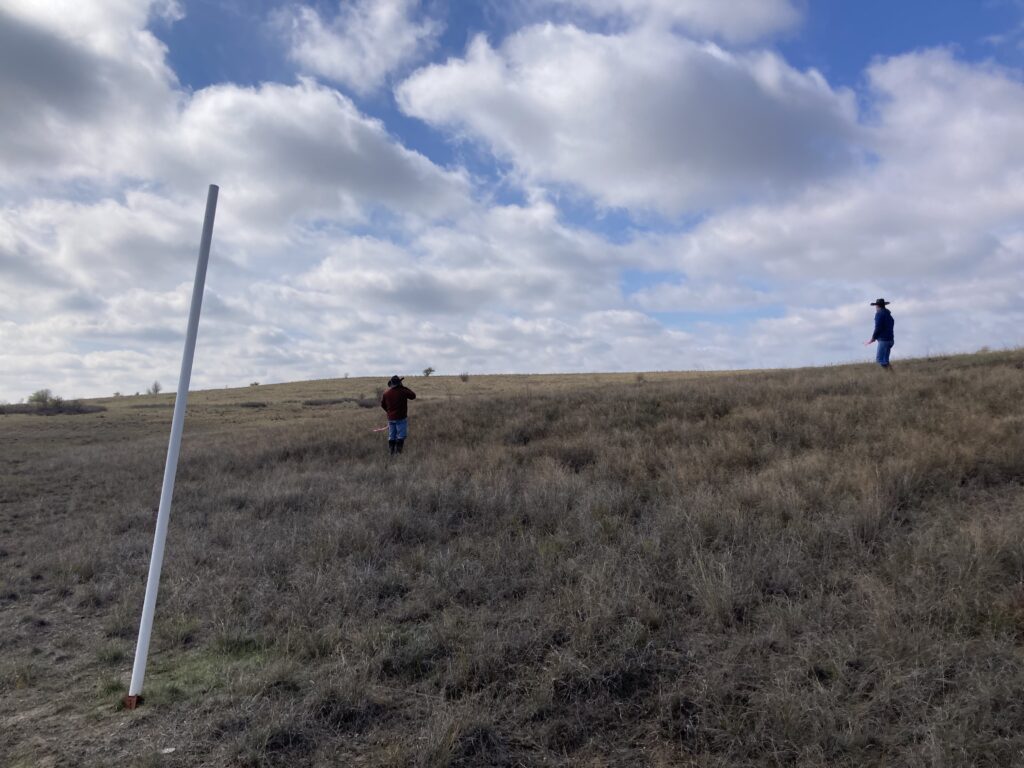
This article summarizes plant community composition documented through Dixon Water Foundation’s in-house monitoring practices. For more in-depth detail about the monitoring efforts, please visit our Annual Reports linked here. Foundation staff conducts annual biological monitoring at the North Texas and West Texas ranches in the fall of each year. The biological monitoring process is modeled after a method developed by Holistic Management International. The process involves traveling to fixed monitoring points each year where staff throw 100 darts into the air around each point. As the darts hit the ground, staff document what type of ground cover the dart landed on: bare ground, litter, or basal plant cover. Staff members also document the type of plant closest to the dart, based on 10 categories for each region.
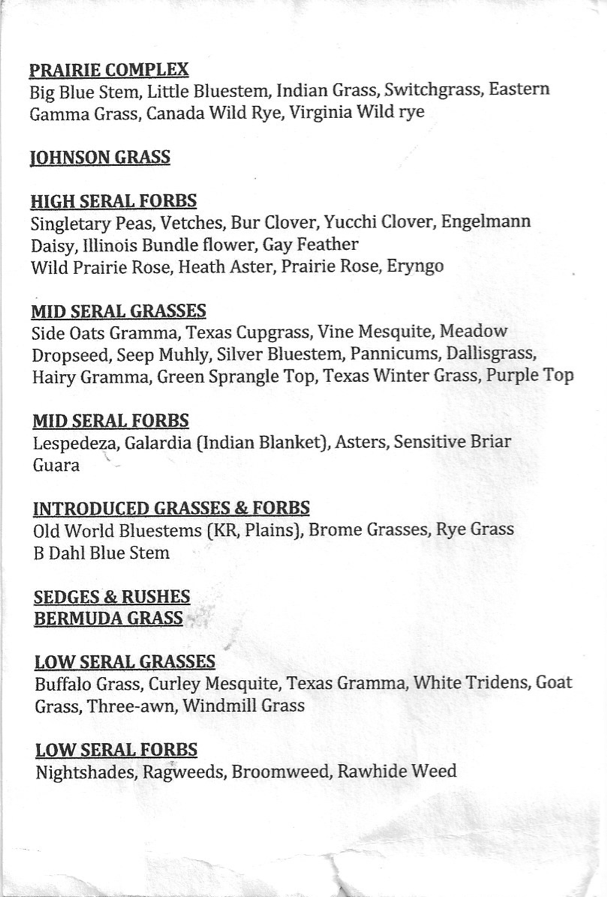
North Texas plant communities consist of: Prairie complex, Johnson Grass, High Seral Forb, Mid Seral Grass, Mid Seral Forb, Introduced Grass, Sedges, Bermuda Grass, Low Seral Grass, and Low Seral Forbs.
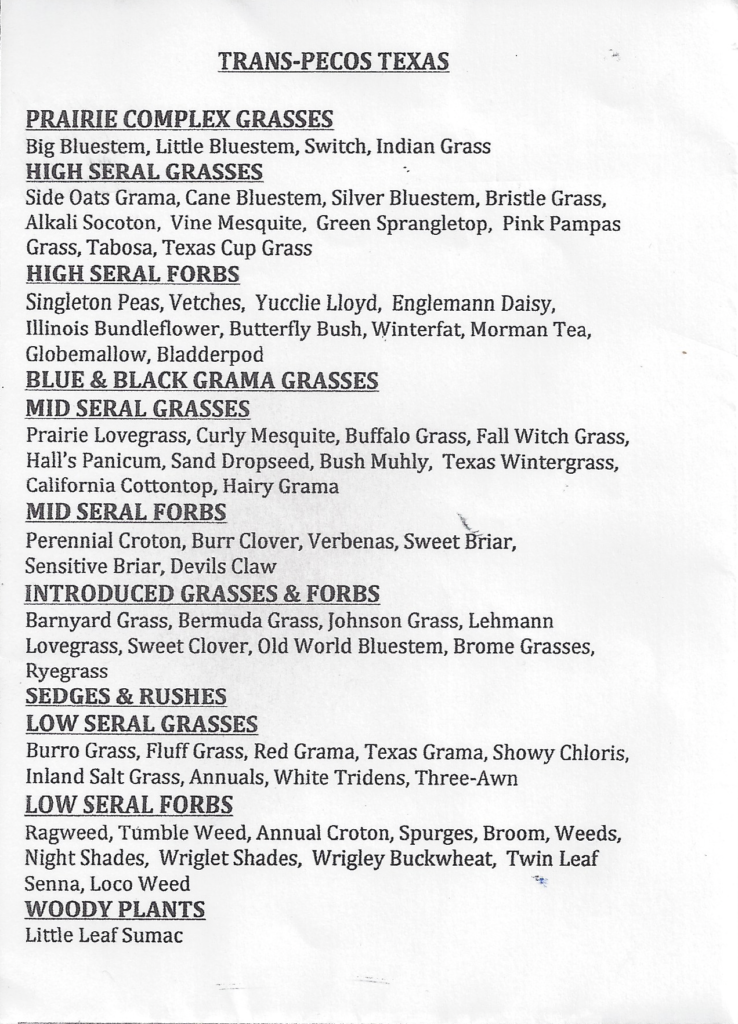
Categories specific to the West Texas (Trans-Pecos) ecoregion are: Prairie complex, High Seral Grass, High Seral Forb, Blue & Black Grama, Mid Seral Grass, Mid Seral Forb, Introduced Grass, Sedges, Low Seral Grass, and Low Seral Forbs.
Example of regional plant community categories used in in-house biological monitoring (Left: North Texas, Right: Trans-Pecos/West Texas)
The resulting dataset spans back to 1989 for some of the North Texas pastures and back to 2008 for the Mimms Unit in Far West Texas. Due to the random nature of the survey technique and variability in the landscape, there is variability in the data. However, when the data is plotted and trend lines are applied, the charts paint a picture illustrating changes in the landscape overtime that can be related to management.
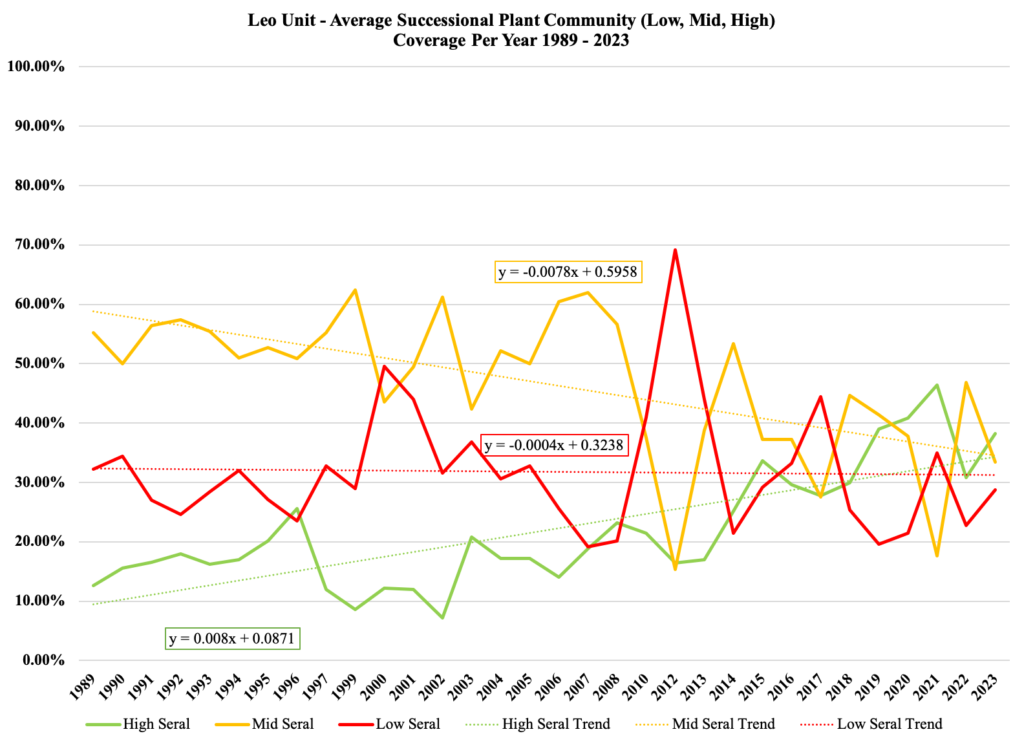
The following plant community charts color-coded for each broad successional plant category: Green indicates High Seral Plants, Yellow indicates Mid Seral Plants, and Red indicates Low Seral Plants. The percentage of documented categories for each year is represented on the vertical axis. The straight, dashed dotted line of the same color for each category represents the trend in that category over time. Time (year) is represented on the horizontal axis). The regression equations posted here are only shown for descriptive purposes. The data doest not meet the assumptions required for a true statistical analysis through linear regression, so the equation is meant to represent the angle of the trend lines to make any differences more discernible.
Leo Unit – North Texas
The Leo Unit is comprised of various parcels of varying topography, ecology, and management history. It is located outside of the town of Decatur, Texas, in the North Central Region of the state, within the Cross Timbers Ecoregion. The Leo Unit received 31.57 inches of rain in 2023. Through decades of multi-paddock grazing, the Foundation has been able to re-establish high plant diversity and the return of many native prairie grasses. However, some pastures are in different successional stages than others due to the state they were in at the time of inclusion into the Foundation’s management, or the ecological site in which the pastures are situated, such as the which may support a different plant community by nature.
When averaging successional plant community ground coverage from all Leo monitoring points (including Forman and Heard), a downward trend can be seen in low seral (y = -0.0004x + 0.3238) and mid seral communities (y = -0.0078x + 0.5958). An upward trend in high seral communities (y = 0.008x + 0.0871), which include prairie complex grasses, Johnson grass, and high successional forbs, can also be seen. This suggests that, on average, the Leo Unit is transitioning towards a high seral, or the desired climax, native prairie vegetative community.
Pittman Unit – North Texas
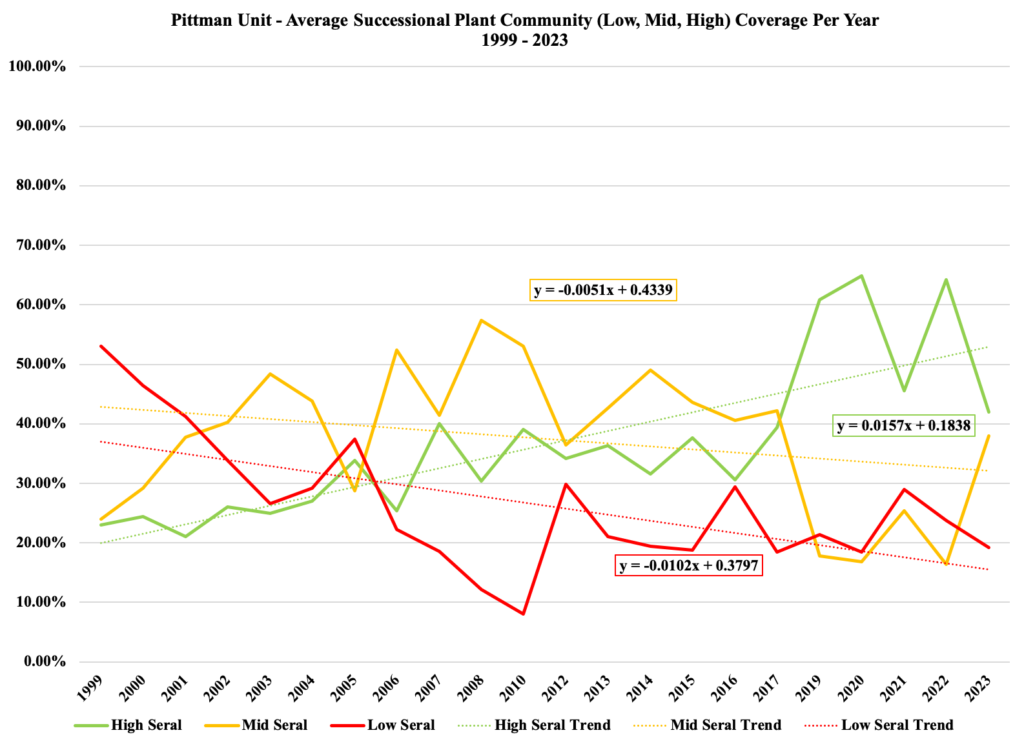
The Pittman Unit is located roughly 7 miles north of the Leo Unit. When averaging successional plant community ground coverage from all Pittman Unit monitoring points, a downward trend can be seen in low seral (y = -0.0102x + 0.3797) and mid seral communities (y = -0.0051x + 0.4339). An upward trend in high seral communities (y = 0.0157x + 0.1838), which include prairie complex grasses, Johnson grass, and high successional forbs, can also be seen. This suggests that, on average, the Pittman Unit is transitioning towards a high seral, or the desired climax, native prairie vegetative community.
Mimms Unit – West Texas
The Mimms Unit is located just outside of Marfa, Texas in Far West Texas, in the Trans-Pecos Ecoregion. The Mimms Unit received around 7 inches of rain in 2023.
Dixon Water Foundation purchased the Mimms Unit in 2008 and began grazing it in 2009. The Mimms Unit has been monitored since 2010. The ranch succumbed to a large fire (“The Rockhouse Fire”) in April 2011, and most of the ranch burned.
A goal of the Mimms Unit is to be able to compare pastures grazed in a low stock density/continuous setting to pastures grazed in a high stock density rest/rotational (also called Adaptive Multi-Paddock Grazing) setting. The Foundation has 4 monitoring points across the larger portion of the ranch which encompasses the rotational grazing pastures, and 2 monitoring points in the continuously grazed pasture.
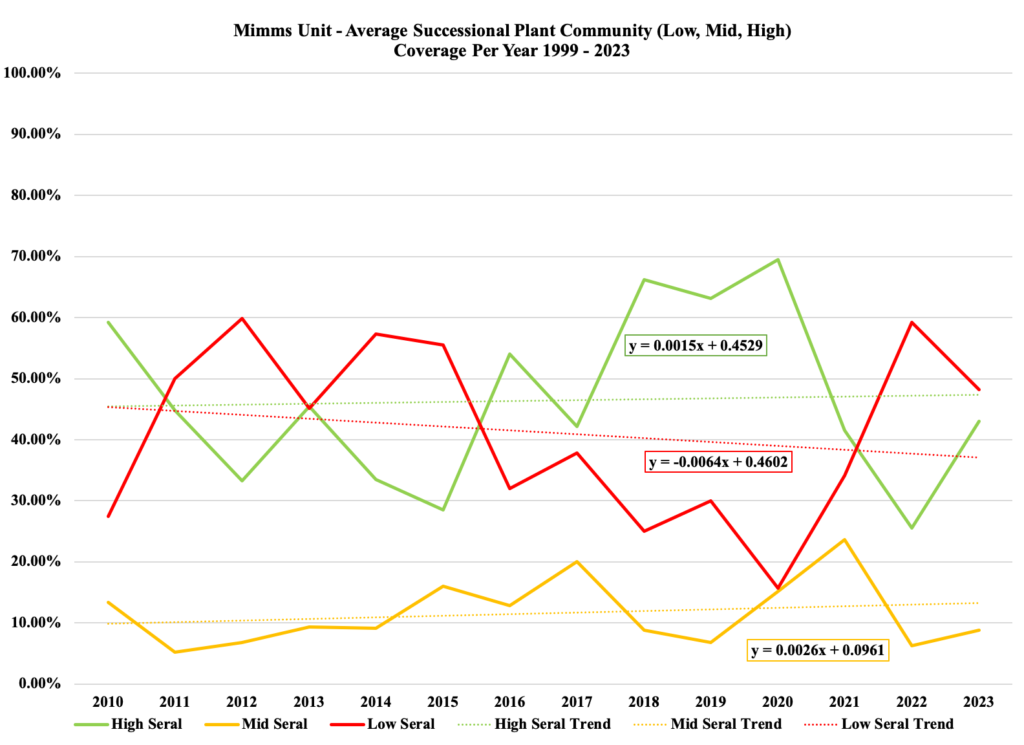
Seral plant community monitoring, averaged across all grazing regimes from 2010-2023, shows a slight increase in high seral plant and mid seral plant communities and a decrease in low seral communities
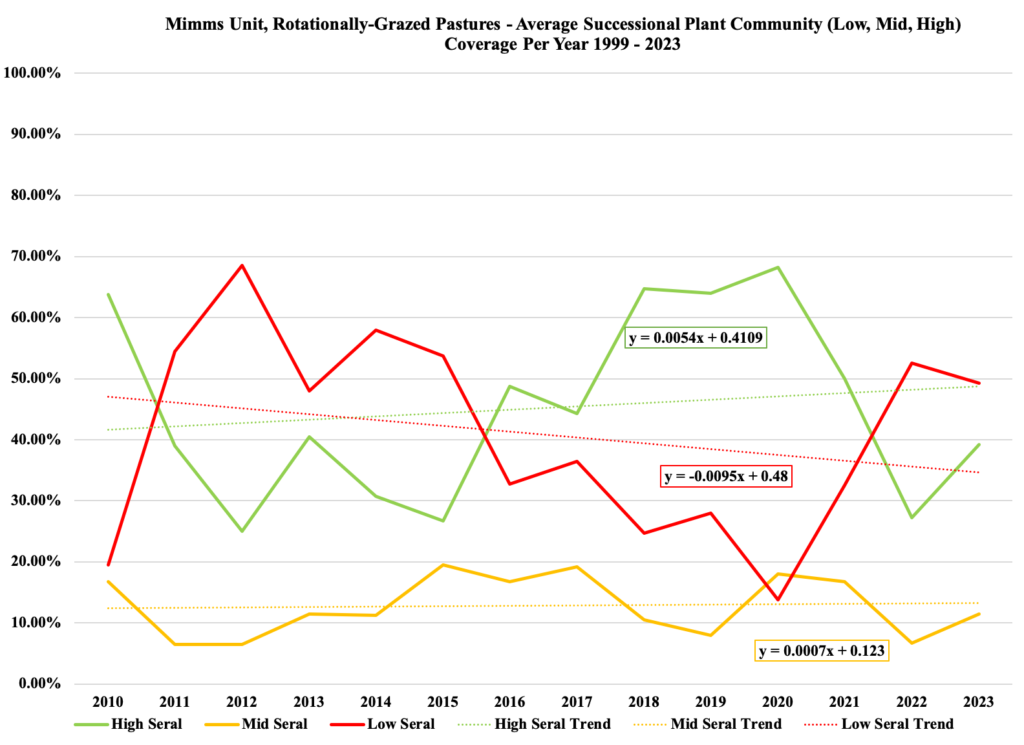
When breaking seral plant community monitoring data out for each grazing regime, the rotationally grazed pastures show an increase in high seral plant community trends (y = 0.0054x + 0.4109). The rotationally grazed pastures show a decreasing trend in low seral plant community coverage (y = -0.0095x + 0.480).
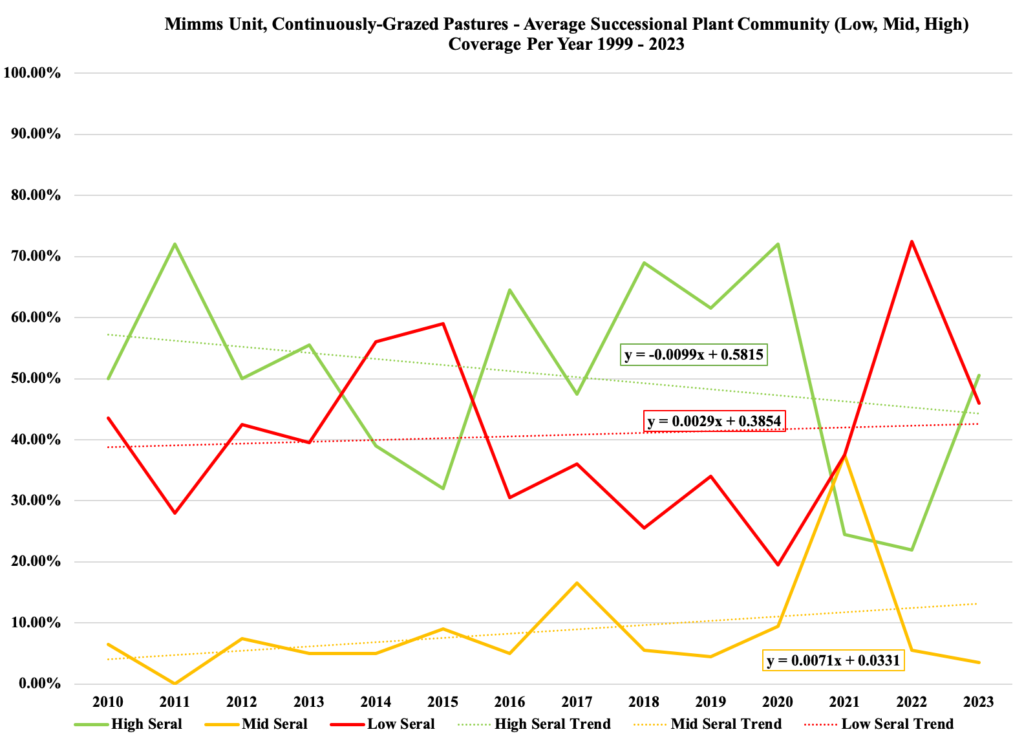
The continuously grazed pasture shows a decreasing trend (y = -0.0099x + 0.5815) in high seral plant community ground cover. The continuously grazed pastures show an increase in low seral plant community coverage (y = 0.0029x + 0.3854). These trends are the inverse of what was documented in the rotationally-grazed pastures.
Anecdotal observations by Foundation staff and guests suggest a similar conclusion when visiting various areas on the ranch to make visual comparisons. This could be that, given the prolonged exposure and opportunity, the continuously grazing herd has selected out more of the high seral plants and that the rest and recovery periods built into the rotationally grazed, adaptive multi-paddock system, has encouraged high seral plant community succession. One important note is that there are fewer monitoring points, and thus a smaller sample size, in the roughly 2,100 ac continuous pasture (2) than there are in the roughly 9,000 acre rotationally grazed pasture. (4)
.
